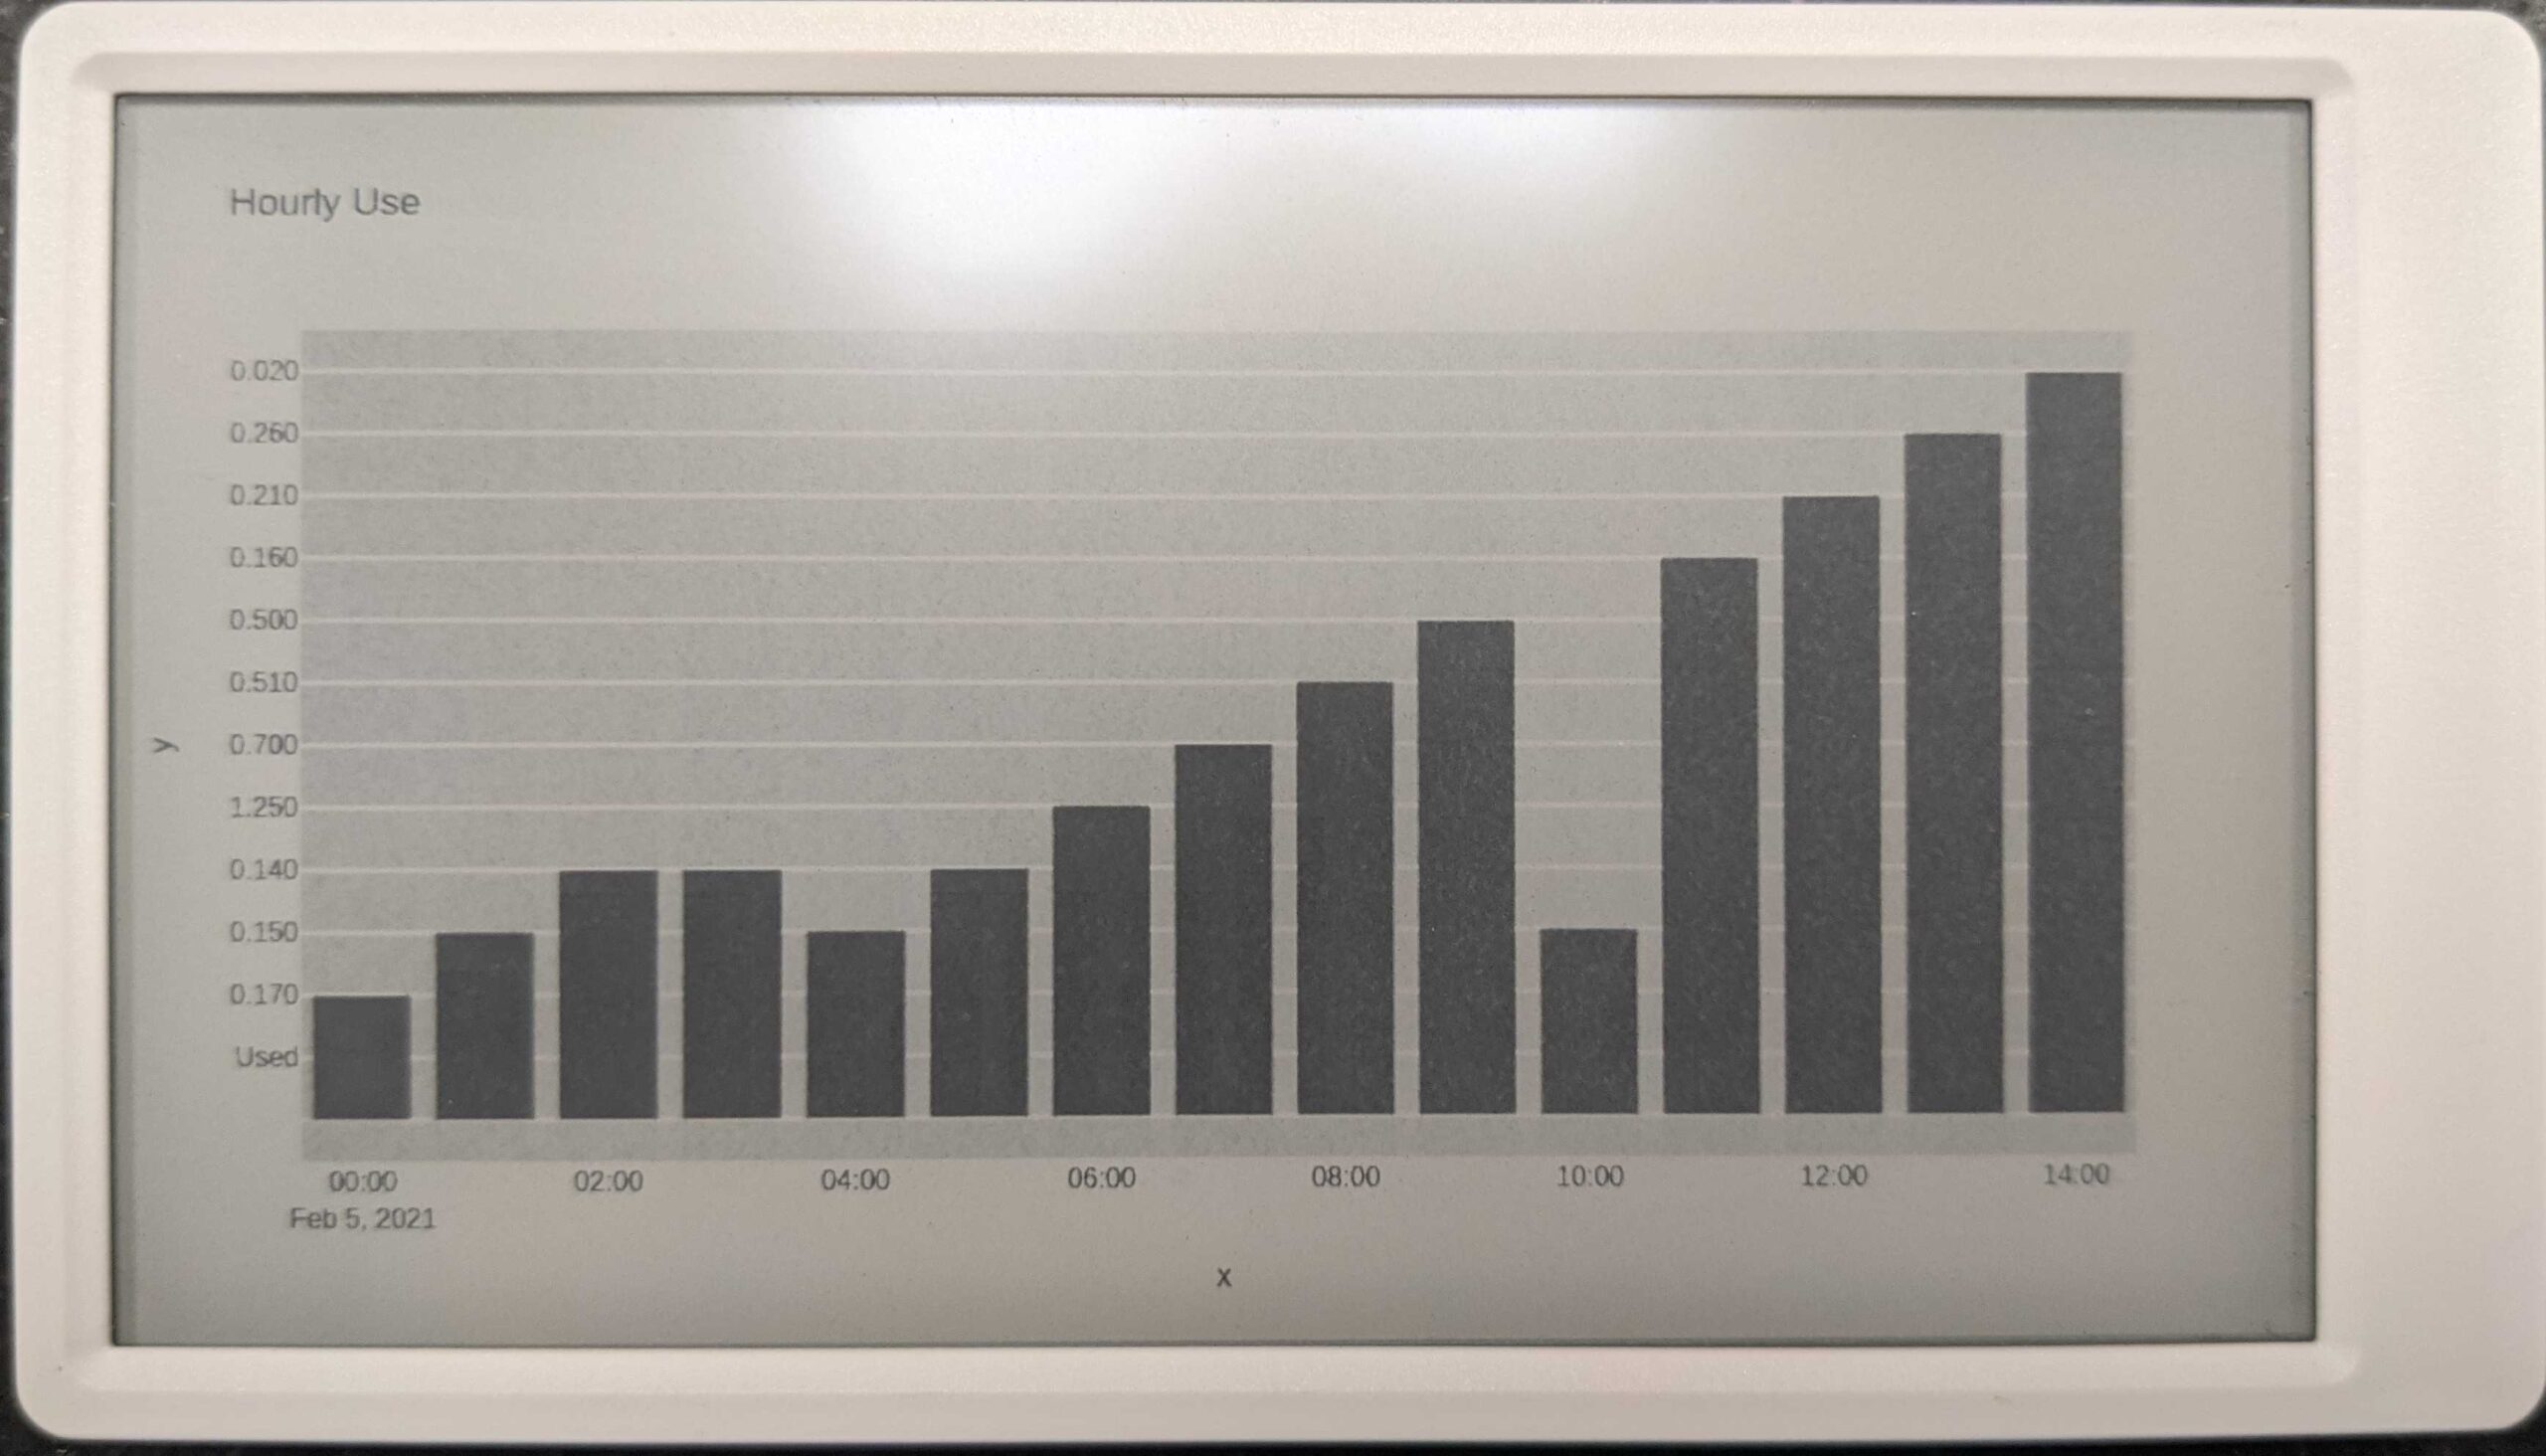
I recently acquired a new Sunpowere home solar system and wanted to build a dashboard to easily see my current generating and usage at a glance. I purchased a M5Paper development board which has a 960×540 eink display powered by an ESP32 to act as the dashboard.
Unfortunately Sunpower doesn’t have an accessible API so I had to scrape their monitor webpage. They dont make it easy so I ended up writing a Python / Selenium script that nagivates the monitor page and downloads a CSV Sunpower provides of the daily generation hour by hour. The Python script is run by a raspberry pi zero thatt does a few other home automation tasks. The Python script then pulls the current data and compares it against the previous hour, as well as building a graph of all hours so far that day. It then pushes images of the generated graphs to a github repo.
The M5paper dashboard is running a simple script to pull the jpeg images from the github repo and display them on the eink display.

